Previous Day OHLC# Previous Day OHLC Levels Indicator
## Overview
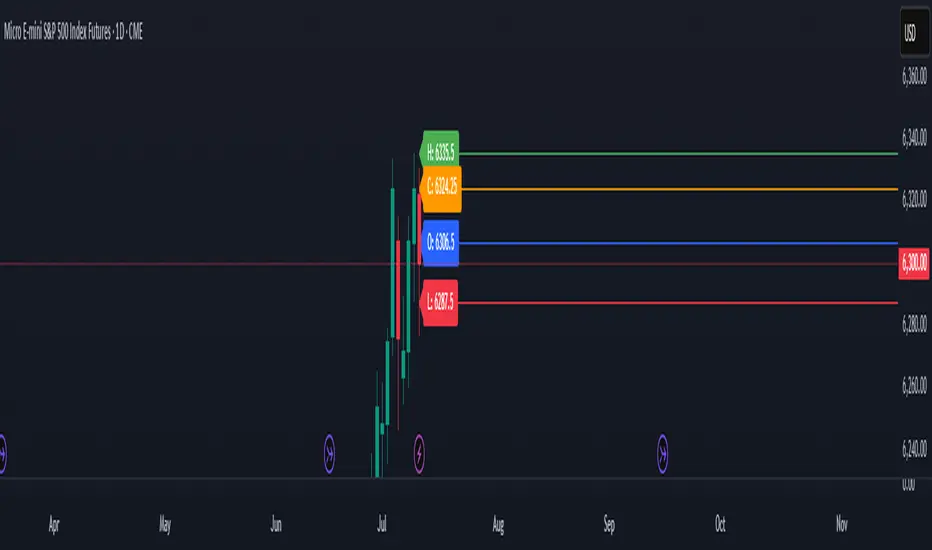
The Previous Day OHLC indicator is a simple yet powerful tool that plots the Open, High, Low, and Close levels from previous trading sessions. This indicator helps traders identify key support and resistance levels based on historical price action, making it easier to spot potential reversal zones and breakout levels.
## Key Features
### 📊 **Previous Day OHLC Levels**
- Displays the Open, High, Low, and Close prices from 1-5 days ago
- Lines automatically extend to the right for easy visualization
- Updates daily to show the most relevant levels
### 🎨 **Fully Customizable Styling**
- **Individual Line Colors**: Choose unique colors for each OHLC level
- **Line Styles**: Select from Solid, Dashed, or Dotted lines for each level
- **Line Width**: Adjust thickness from 1-4 pixels for better visibility
- **Price Labels**: Display actual price values on each line with customizable sizing
### ⚙️ **Flexible Settings**
- **Lookback Period**: Choose to display levels from 1-5 days ago (maximum safety limit)
- **Label Control**: Toggle price labels on/off and adjust their size
- **Performance Optimized**: Clean code that won't slow down your charts
## How to Use
1. **Add to Chart**: Apply the indicator to any timeframe chart
2. **Customize Settings**: Adjust colors, styles, and lookback period to your preference
3. **Identify Levels**: Use the plotted lines as potential support/resistance zones
4. **Trade Setup**: Look for price reactions at these key levels for entry/exit signals
## Best Practices
- **Day Trading**: Use 1-day lookback for intraday support/resistance
- **Swing Trading**: Extend lookback to 2-5 days for broader context
- **Multi-Timeframe**: Combine with other timeframe analysis for confirmation
- **Risk Management**: Use these levels for stop-loss and take-profit placement
## Color Coding (Default)
- **Open**: Blue - Starting price of the previous session
- **High**: Green - Highest price reached
- **Low**: Red - Lowest price reached
- **Close**: Orange - Final price of the session
## Why This Indicator Works
Previous day OHLC levels are among the most watched price points by professional traders. These levels often act as:
- **Support/Resistance**: Price tends to react at these historical levels
- **Breakout Confirmation**: Strong moves beyond these levels can signal trend continuation
- **Reversal Zones**: Price often bounces from these key levels
- **Psychological Levels**: Market participants remember these important price points
## Technical Specifications
- **Pine Script Version**: v6
- **Overlay**: Yes (plots directly on price chart)
- **Performance**: Optimized for smooth chart operation
- **Compatibility**: Works on all timeframes and instruments
Perfect for traders of all experience levels who want to incorporate previous day levels into their technical analysis toolkit!
Поиск скриптов по запросу "key levels"
Session Range ProjectionsSession Range Projections
Purpose & Concept:
Session Range Projections is a comprehensive trading tool that identifies and analyzes price ranges during user-defined time periods. The indicator visualizes high-probability reversal zones and profit targets by projecting Fibonacci levels from custom session ranges, making it ideal for traders who focus on time-based market structure analysis.
Key Features & Calculations:
1. Custom Time Range Analysis
- Define any time period for range calculation - from traditional sessions (Asian, London, NY) to custom periods like opening ranges, hourly ranges, or 4-hour blocks
- Automatically captures the highest and lowest prices within your specified timeframe
- Supports multiple timezone selections for global market analysis
- Flexible enough for intraday scalping ranges or longer-term swing trading setups
2. Premium & Discount Zones
- Automatically divides the range into premium (above 50%) and discount (below 50%) zones
- Visual differentiation helps identify institutional buying and selling areas
- Color-coded boxes clearly mark these critical price zones
3. Optimal Trade Entry (OTE) Zones
- Highlights the 79-89% retracement zone in premium territory
- Highlights the 11-21% retracement zone in discount territory
- These zones represent high-probability reversal areas based on institutional order flow concepts
4. Fibonacci Projections
- Projects 11 customizable Fibonacci extension levels from the range extremes
- Levels extend both above and below the range for symmetrical analysis
- Each level can be individually toggled and color-customized
- Default levels include common retracement ratios: -0.5, -1.0, -2.0, -2.33, -2.5, -3.0, -4.0, -4.5, -6.0, -7.0, -8.0
How to Use:
Set Your Time Range: Input your desired session start and end times (24-hour format)
Select Timezone: Choose the appropriate timezone for your trading session
Customize Display: Toggle various visual elements based on your preferences
Monitor Price Action: Watch for reactions at projected levels and OTE zones
Set Alerts: Configure sweep alerts for when price breaks above/below range extremes
Input Parameters Explained:
Time Range Settings
Range Start/End Hour & Minute: Define your analysis period
Time Zone: Ensure accurate session timing across different markets
Visual Settings
Range Box: Toggle the premium/discount zone visualization
Horizontal Lines: Customize high/low line appearance
Internal Range Levels: Show/hide equilibrium and OTE zones
Labels: Configure text display for key levels
Fibonacci Projections: Enable/disable extension levels
Display Settings
Historical Ranges: Show up to 10 previous session ranges
Alert Type: Choose between high sweep, low sweep, or both
Trading Applications:
Session-Based Trading: Analyze specific market sessions (Asian, London, New York, opening ranges, hourly ranges)
Reversal Trading: Identify high-probability reversal zones at OTE levels
Breakout/Reversal Trading: Monitor range breaks/reversals with built-in sweep alerts
Risk Management: Use Fibonacci projections as profit targets or rejection areas
Multi-Timeframe Analysis: Apply to any timeframe for various trading styles
Important Notes:
This indicator is for educational purposes only and should not be considered financial advice
Past performance does not guarantee future results
Always use proper risk management when trading
The indicator automatically manages historical data to maintain chart performance

Price Map Profile [BigBeluga]An advanced volume-based tool designed to map out how trading activity is distributed across price levels. It combines dynamic volume profiling with structural pivot detection to highlight key levels of interest in the market — including hidden support/resistance zones and dominant liquidity areas.
Unlike traditional volume profiles locked to fixed sessions, this indicator continuously processes historical bars to build a real-time "map" of volume distribution. It intelligently reveals where buyers and sellers were most active, helping traders pinpoint high-impact zones with clarity.
🔵 KEY FEATURES
Creates a volume map profile by scanning price action over a defined lookback window (`length`).
Divides price vertically into volume bins (default: 100) and aggregates either total volume or bar count per bin.
Bins are plotted as horizontal zones extending to the right of the chart — wider offset means more volume at that price.
Each zone is color-coded using gradients to represent volume magnitude:
- Below average volume = cool tones (blue/teal)
- Above average volume = warm tones (red/orange)
The highest volume bin is highlighted with a red label showing the exact volume, helping to identify strong price agreement.
Detects pivot highs and lows using a 15-bar swing method, marking them as potential S/R levels.
If a pivot level is located inside a low-volume zone (volume < average), it is emphasized with a dashed line and label .
Pivot line color matches direction:
- High pivots = yellow
- Low pivots = aqua
The volume of the bin containing the pivot is shown alongside the pivot, providing volume context for the structural level.
Filters out nearby duplicate pivots using ATR-based distance checks to ensure clean and non-redundant signals.
🔵 HOW TO USE
Use the wide red zones as liquidity and consolidation areas where price may stall, reverse, or absorb volume.
Pivot-based dashed lines within low-volume zones highlight hidden support/resistance levels where price may react sharply.
Combine this indicator with trend or order flow tools to validate reversal or breakout setups .
Switch between Volume and Frequency modes to adapt to the type of data your asset provides.
🔵 CONCLUSION
The Price Map Profile transforms raw volume into an actionable visual map. By aligning volume depth with key market structure levels, it helps traders identify where market participants are most active — and where hidden inefficiencies lie. Ideal for traders seeking precision entries, dynamic S/R zones, and deeper volume structure insight.

Easy MA SignalsEasy MA Signals
Overview
Easy MA Signals is a versatile Pine Script indicator designed to help traders visualize moving average (MA) trends, generate buy/sell signals based on crossovers or custom price levels, and enhance chart analysis with volume-based candlestick coloring. Built with flexibility in mind, it supports multiple MA types, crossover options, and customizable signal appearances, making it suitable for traders of all levels. Whether you're a day trader, swing trader, or long-term investor, this indicator provides actionable insights while keeping your charts clean and intuitive.
Configure the Settings
The indicator is divided into three input groups for ease of use:
General Settings:
Candlestick Color Scheme: Choose from 10 volume-based color schemes (e.g., Sapphire Pulse, Emerald Spark) to highlight high/low volume candles. Select “None” for TradingView’s default colors.
Moving Average Length: Set the MA period (default: 20). Adjust for faster (lower values) or slower (higher values) signals.
Moving Average Type: Choose between SMA, EMA, or WMA (default: EMA).
Show Buy/Sell Signals: Enable/disable signal plotting (default: enabled).
Moving Average Crossover: Select a crossover type (e.g., MA vs VWAP, MA vs SMA50) for signals or “None” to disable.
Volume Influence: Adjust how volume impacts candlestick colors (default: 1.2). Higher values make thresholds stricter.
Signal Appearance Settings:
Buy/Sell Signal Shape: Choose shapes like triangles, arrows, or labels for signals.
Buy/Sell Signal Position: Place signals above or below bars.
Buy/Sell Signal Color: Customize colors for better visibility (default: green for buy, red for sell).
Custom Price Alerts:
Custom Buy/Sell Alert Price: Set specific price levels for alerts (default: 0, disabled). Enter a non-zero value to enable.
Set Up Alerts
To receive notifications (e.g., sound, popup, email) when signals or custom price levels are hit:
Click the Alert button (alarm clock icon) in TradingView.
Select Easy MA Signals as the condition and choose one of the four alert types:
MA Crossover Buy Alert: Triggers on MA crossover buy signals.
MA Crossover Sell Alert: Triggers on MA crossover sell signals.
Custom Buy Alert: Triggers when price crosses above the custom buy price.
Custom Sell Alert: Triggers when price crosses below the custom sell price.
Enable Play Sound and select a sound (e.g., “Bell”).
Set the frequency (e.g., Once Per Bar Close for confirmed signals) and create the alert.
Analyze the Chart
Moving Average Line: Displays the selected MA with color changes (green for bullish, red for bearish, gray for neutral) based on price position relative to the MA.
Buy/Sell Signals: Appear as shapes or labels when crossovers or custom price levels are hit.
Candlestick Colors: If a color scheme is selected, candles change color based on volume strength (high, low, or neutral), aiding in trend confirmation.
Why Use Easy MA Signals?
Easy MA Signals is designed to simplify technical analysis while offering advanced customization. It’s ideal for traders who want:
A clear visualization of MA trends and crossovers.
Flexible signal generation based on MA crossovers or custom price levels.
Volume-enhanced candlestick coloring to identify market strength.
Easy-to-use settings with tooltips for beginners and pros alike.
This script is particularly valuable because it combines multiple features into one indicator, reducing chart clutter and providing actionable insights without overwhelming the user.
Benefits of Easy MA Signals
Highly Customizable: Supports SMA, EMA, and WMA with adjustable lengths.
Offers multiple crossover options (VWAP, SMA10, SMA20, etc.) for tailored strategies.
Custom price alerts allow precise targeting of key levels.
Volume-Based Candlestick Coloring: 10 unique color schemes highlight volume strength, helping traders confirm trends.
Adjustable volume influence ensures adaptability to different markets.
Flexible Signal Visualization: Choose from various signal shapes (triangles, arrows, labels) and positions (above/below bars).
Customizable colors improve visibility on any chart background.
Alert Integration: Built-in alert conditions for crossovers and custom prices support sound, email, and app notifications.
Easy setup for real-time trading decisions.
User-Friendly Design: Organized input groups with clear tooltips make configuration intuitive.
Suitable for beginners and advanced traders alike.
Example Use Cases
Swing Trading with MA Crossovers:
Scenario: A trader wants to trade Bitcoin (BTC/USD) on a 4-hour chart using an EMA crossover strategy.
Setup:
Set Moving Average Type to EMA, Length to 20.
Set Moving Average Crossover to “MA vs SMA50”.
Enable Show Buy/Sell Signals and choose “arrowup” for buy, “arrowdown” for sell.
Select “Emerald Spark” for candlestick colors to highlight volume surges.
Usage: Buy when the EMA20 crosses above the SMA50 (green arrow appears) and volume is high (dark green candles). Sell when the EMA20 crosses below the SMA50 (red arrow). Set alerts for real-time notifications.
Scalping with Custom Price Alerts:
Scenario: A day trader monitors Tesla (TSLA) on a 5-minute chart and wants alerts at specific support/resistance levels.
Setup:
Set Custom Buy Alert Price to 150.00 (support) and Custom Sell Alert Price to 160.00 (resistance).
Use “labelup” for buy signals and “labeldown” for sell signals.
Keep Moving Average Crossover as “None” to focus on price alerts.
Usage: Receive a sound alert and label when TSLA crosses 150.00 (buy) or 160.00 (sell). Use volume-colored candles to confirm momentum before entering trades.
When NOT to Use Easy MA Signals
High-Frequency Trading: Reason: The indicator relies on moving averages and volume, which may lag in ultra-fast markets (e.g., sub-second trades). High-frequency traders may need specialized tools with real-time tick data.
Alternative: Use order book or market depth indicators for faster execution.
Low-Volatility or Sideways Markets:
Reason: MA crossovers and custom price alerts can generate false signals in choppy, range-bound markets, leading to whipsaws.
Alternative: Use oscillators like RSI or Bollinger Bands to trade within ranges.
This indicator is tailored more towards less experienced traders. And as always, paper trade until you are comfortable with how this works if you're unfamiliar with trading! We hope you enjoy this and have great success. Thanks for your interested in Easy MA Signals!

PowerZone Trading StrategyExplanation of the PowerZone Trading Strategy for Your Users
The PowerZone Trading Strategy is an automated trading strategy that detects strong price movements (called "PowerZones") and generates signals to enter a long (buy) or short (sell) position, complete with predefined take profit and stop loss levels. Here’s how it works, step by step:
1. What is a PowerZone?
A "PowerZone" (PZ) is a zone on the chart where the price has shown a significant and consistent movement over a specific number of candles (bars). There are two types:
Bullish PowerZone (Bullish PZ): Occurs when the price rises consistently over several candles after an initial bearish candle.
Bearish PowerZone (Bearish PZ): Occurs when the price falls consistently over several candles after an initial bullish candle.
The code analyzes:
A set number of candles (e.g., 5, adjustable via "Periods").
A minimum percentage move (adjustable via "Min % Move for PowerZone") to qualify as a strong zone.
Whether to use the full candle range (highs and lows) or just open/close prices (toggle with "Use Full Range ").
2. How Does It Detect PowerZones?
Bullish PowerZone:
Looks for an initial bearish candle (close below open).
Checks that the next candles (e.g., 5) are all bullish (close above open).
Ensures the total price movement exceeds the minimum percentage set.
Defines a range: from the high (or open) to the low of the initial candle.
Bearish PowerZone:
Looks for an initial bullish candle (close above open).
Checks that the next candles are all bearish (close below open).
Ensures the total price movement exceeds the minimum percentage.
Defines a range: from the high to the low (or close) of the initial candle.
These zones are drawn on the chart with lines: green or white for bullish, red or blue for bearish, depending on the color scheme ("DARK" or "BRIGHT").
3. When Does It Enter a Trade?
The strategy waits for a breakout from the PowerZone range to enter a trade:
Buy (Long): When the price breaks above the high of a Bullish PowerZone.
Sell (Short): When the price breaks below the low of a Bearish PowerZone.
The position size is set to 100% of available equity (adjustable in the code).
4. Take Profit and Stop Loss
Take Profit (TP): Calculated as a multiple (adjustable via "Take Profit Factor," default 1.5) of the PowerZone height. For example:
For a buy, TP = Entry price + (PZ height × 1.5).
For a sell, TP = Entry price - (PZ height × 1.5).
Stop Loss (SL): Calculated as a multiple (adjustable via "Stop Loss Factor," default 1.0) of the PZ height, placed below the range for buys or above for sells.
5. Visualization on the Chart
PowerZones are displayed with lines on the chart (you can hide them with "Show Bullish Channel" or "Show Bearish Channel").
An optional info panel ("Show Info Panel") displays key levels: PZ high and low, TP, and SL.
You can also enable brief documentation on the chart ("Show Documentation") explaining the basic rules.
6. Alerts
The code generates automatic alerts in TradingView:
For a bullish breakout: "Bullish PowerZone Breakout - LONG!"
For a bearish breakdown: "Bearish PowerZone Breakdown - SHORT!"
7. Customization
You can tweak:
The number of candles to detect a PZ ("Periods").
The minimum percentage move ("Min % Move").
Whether to use highs/lows or just open/close ("Use Full Range").
The TP and SL factors.
The color scheme and what elements to display on the chart.
Practical Example
Imagine you set "Periods = 5" and "Min % Move = 2%":
An initial bearish candle appears, followed by 5 consecutive bullish candles.
The total move exceeds 2%.
A Bullish PowerZone is drawn with a high and low.
If the price breaks above the high, you enter a long position with a TP 1.5 times the PZ height and an SL equal to the height below.
The system executes the trade and exits automatically at TP or SL.
Conclusion
This strategy is great for capturing strong price movements after consolidation or momentum zones. It’s automated, visual, and customizable, making it useful for both beginner and advanced traders. Try it out and adjust it to fit your trading style!

PriorHourRangeLevels_v0.1PriorHourRangeLevels_v0.1
Created by dc_77 | © 2025 | Mozilla Public License 2.0
Overview
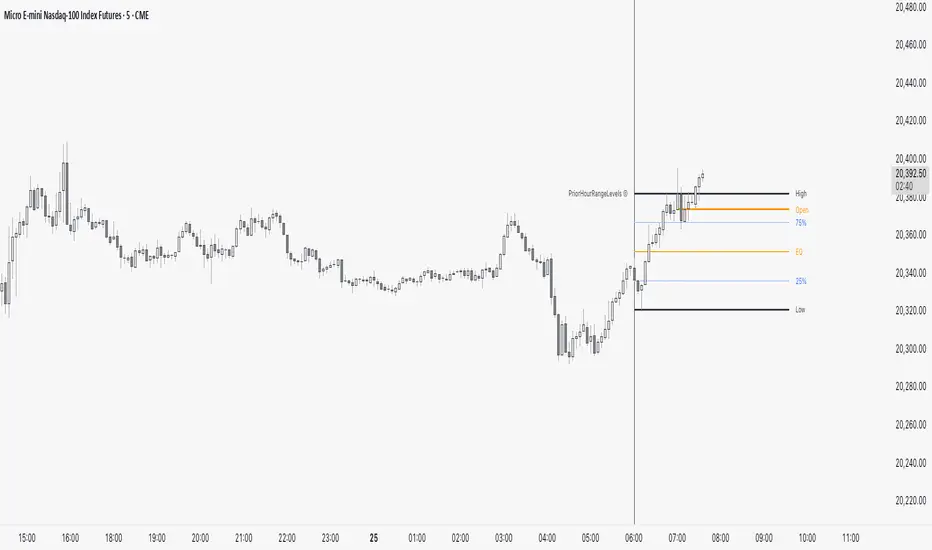
"PriorHourRangeLevels_v0.1" is a versatile Pine Script™ indicator designed to help traders visualize and analyze price levels based on the prior hour’s range. It overlays key levels—High, Low, 75%, 50% (EQ), and 25%—from the previous hour onto the current price chart, alongside the current hour’s opening price. With customizable display options and time zone support, it’s ideal for intraday traders looking to identify support, resistance, and breakout zones.
How It Works
Hourly Reset: The indicator detects the start of each hour based on your chosen time zone (e.g., "America/New_York" by default).
Prior Hour Range: It calculates the High and Low of the previous hour, then derives three additional levels:
75%: 75% of the range above the Low.
EQ (50%): The midpoint of the range.
25%: 25% of the range above the Low.
Current Hour Open: Displays the opening price of the current hour.
Projection: Lines extend forward (default: 24 bars) to project these levels into the future, aiding in real-time analysis.
Alerts: Triggers alerts when the price crosses any of the prior hour’s levels (High, 75%, EQ, 25%, Low).
Key Features
Time Zone Flexibility: Choose from options like UTC, New York, Tokyo, or London to align with your trading session.
Visual Customization:
Toggle visibility for each level (High, Low, 75%, EQ, 25%, Open, and Anchor).
Adjust line styles (Solid, Dashed, Dotted), colors, and widths.
Show or hide labels with adjustable sizes (Tiny, Small, Normal, Large).
Anchor Line: A vertical line marks the start of the prior hour, with optional labeling.
Alert Conditions: Set up notifications for price crossings to catch key moments without watching the chart.
Usage Tips
Use the High and Low as potential breakout levels, while 75%, EQ, and 25% act as intermediate support/resistance zones.
Trend Confirmation: Watch how price interacts with the EQ (50%) level to gauge momentum.
Session Planning: Adjust the time zone to match your market (e.g., "Europe/London" for FTSE trading).
Projection Offset: Extend or shorten the lines (via "Projection Offset") based on your chart timeframe.
Inputs
Time Zone: Select your preferred market time zone.
Anchor Settings: Show/hide the prior hour start line, style, color, width, and label.
Level Settings: Customize visibility, style, color, width, and labels for Open, High, 75%, EQ, 25%, and Low.
Display: Set projection length and label size.
RSI with Trend LinesThe RSI with Trend Lines indicator is a tool designed to analyze the behavior of the Relative Strength Index (RSI) combined with dynamic trend lines. This indicator not only provides the standard RSI reading but also identifies pivot points on the RSI and draws bullish and bearish trend lines based on these points. It also includes customizable options for adjusting trend lines, displaying the RSI moving average, and highlighting key levels such as overbought, oversold, and the center line.
This indicator is ideal for finding and identifying clear trends in the RSI and taking advantage of market breakout or consolidation signals. It also includes a table with the POC value, which represents the price level at which the most trading activity has occurred, indicating the highest liquidity and highest trading volume.
Key Features:
1. Basic RSI:
• Calculates the RSI using a configurable period length (default 14).
• Colors the RSI based on its direction (green for rising, red for falling) and its position relative to the center line (50).
2. Key Levels:
• Displays overbought (70 and 80), oversold (20 and 30), and the center line (50) levels for easy visual interpretation.
3. RSI Moving Average:
• Enables and configures an RSI moving average (SMA, EMA, WMA, or ALMA) to smooth out fluctuations and detect clearer trends.
4. Dynamic Trend Lines:
• Identifies pivot points on the RSI and draws bullish and bearish trend lines.
• Trend lines can be extended into the future or limited to the visible range.
• Includes options to display broken lines (trends that are no longer valid) and customize the style (solid or dashed).
5. Pivot Points:
• Displays the high and low pivot points on the chart for a better understanding of trend changes.
6. Advanced Customization:
• Adjust the pivot point period.
• Control the number of pivot points to consider for trend lines.
• Customize the line thickness and style.
How to Use the Indicator:
1. RSI Interpretation:
• Overbought Zone (RSI > 70): Indicates that the asset may be overvalued and could correct downward.
• Oversold Zone (RSI < 30): Suggests that the asset may be undervalued and could rebound.
• Centerline Crossover (50): A cross above 50 indicates bullish strength, while a cross below suggests weakness.
2. Trend Lines:
• Bullish Lines: Drawn when the RSI forms ascending low pivot points. These lines represent dynamic support.
• Bearish Lines: These are drawn when the RSI forms descending high pivot points. These lines represent dynamic resistance.
• Broken Lines: When a trend line becomes invalid (the RSI breaks the line), they are displayed in a dotted style to highlight the breakout.
3. Possible Trading Signals:
• Buy: When the RSI breaks an upward downtrend line.
• Sell: When the RSI breaks a downward uptrend line.
• Trend Confirmation: When the RSI stays within a valid trend line, it suggests that the current trend is strong.
4. A chart with the POC value:
• The point of control is a price level at which the highest trading volume occurs in a given time period. It is a key component of the Volume Profile indicator, which displays volume by price.
• Use of the POC in trading:
• The POC is used to identify areas of high interest and liquidity for trading.
• The POC provides information about the equilibrium point where buyers and sellers are most evenly matched.
• Therefore, it can be considered a zone of interest, meaning it can act as support or resistance.

Highs & Lows - Multi TimeFrame### **📌 HL-MWD (Highs & Lows - Multi Timeframe Indicator) – Community Release**
#### **🔹 Overview**
The **HL-MWD Indicator** is a **multi-timeframe support & resistance tool** that plots **historical highs and lows** from **daily, weekly, and monthly timeframes** onto an intraday chart. It helps traders **identify key levels of support and resistance** that have influenced price action over different timeframes.
This indicator is useful for **day traders, swing traders, and position traders** who rely on **multi-timeframe analysis** to spot critical price levels.
---
### **🔥 Key Features**
✅ **Plots Highs & Lows for Daily, Weekly, and Monthly Timeframes**
✅ **Customizable Lookback Periods for Each Timeframe**
✅ **Adjustable Line Colors, Styles (Solid, Dotted, Dashed), and Widths**
✅ **Extend Lines into the Future to Identify Key Price Levels**
✅ **Option to Display Price Labels for Each Level**
✅ **Gradient Option to Highlight Recent Highs & Lows (Disabled by Default)**
✅ **Compatible with Intraday, Daily, and Weekly Charts**
---
### **📈 How It Works**
- **Daily Highs & Lows:** Captures the **highest and lowest prices** within the selected lookback period (default: **14 bars**).
- **Weekly Highs & Lows:** Marks the **highest and lowest prices** within the chosen weekly lookback (default: **52 bars**).
- **Monthly Highs & Lows:** Displays the **high and low points** from the monthly timeframe (default: **36 bars**).
- **Extended Lines:** Project past highs and lows **into the future** to help identify **potential support & resistance zones**.
---
### **⚠️ TradingView Lookback Limitations**
🔹 **TradingView has a limit on how many historical bars can be accessed per timeframe**, which affects how far back the indicator can retrieve data.
🔹 **Intraday charts (e.g., 5m, 15m) have a limited number of past bars**, meaning:
- **You won’t be able to view 36 months' worth of monthly levels** on a **5-minute chart**, because TradingView doesn’t store that much data in lower timeframes.
- **If multiple timeframes (e.g., weekly + monthly) are enabled at the same time**, some historical data may **not be available on shorter timeframes**.
🔹 **Recommendation:**
- If using **monthly lookbacks (36 months+), view them on a daily or higher timeframe**.
- If using **weekly lookbacks (52 weeks+), higher intraday timeframes (e.g., 1-hour, 4-hour) are better suited**.
- **Lower timeframes (1m, 5m, 15m) may miss some levels** if TradingView's bar limit is exceeded.
---
### **⚙️ Customization Options**
| **Setting** | **Default Value** | **Description** |
|------------------|----------------|----------------|
| **Daily Lookback** | `14` | Number of bars used to calculate daily highs/lows. |
| **Weekly Lookback** | `52` | Number of bars used to calculate weekly highs/lows. |
| **Monthly Lookback** | `36` | Number of bars used to calculate monthly highs/lows. |
| **Line Colors** | Daily: `Blue` Weekly: `Green` Monthly: `Red` | Customizable colors for each timeframe. |
| **Line Style** | `Solid` | Options: Solid, Dashed, Dotted. |
| **Line Width** | `1` | Thickness of the plotted lines. |
| **Extend Line** | `1` | Controls how far the highs/lows extend into the future. |
| **Display Price Labels** | `Enabled` | Shows price labels on each level. |
---
### **🛠️ How to Use It**
- **Enable/disable different timeframes** based on your strategy.
- **Customize colors, line styles, and widths** to match your charting style.
- **Use extended lines to identify support & resistance zones.**
- **Watch price reactions at these levels** for potential entries, exits, and stop-loss placements.
---
### **🚀 Final Thoughts**
The **HL-MWD Indicator** is a **powerful multi-timeframe tool** that helps traders **visualize key support & resistance levels** from higher timeframes on an intraday chart.
⚠️ **However, TradingView’s lookback limits apply—so for longer-term levels, higher timeframes are recommended.**
📌 **Now published for the community!** Let me know if you need any last-minute tweaks! 🔥

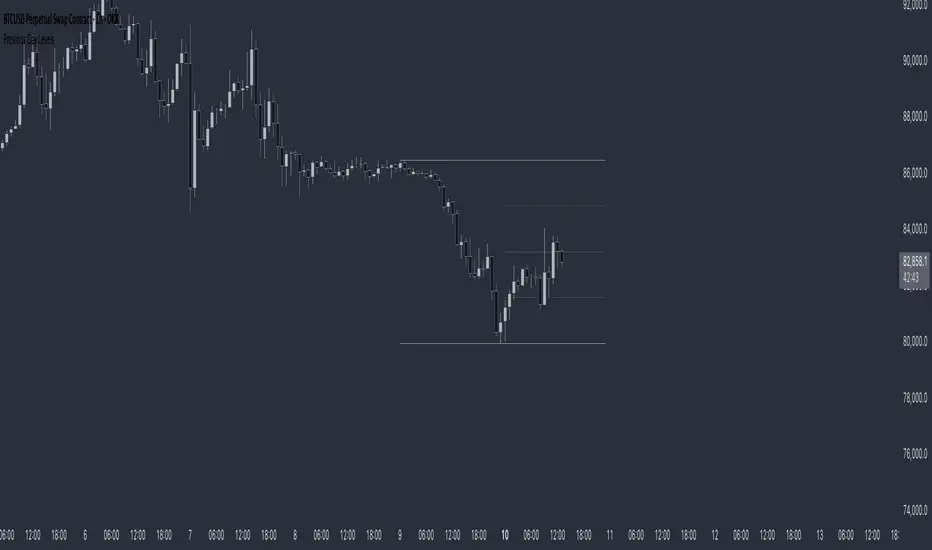
Previous Day LevelsThis indicator plots the previous day's high, low, and 50% levels, providing a framework for analyzing price behavior relative to these key levels.
Full Description:
The Previous Day Levels indicator is a tool designed to help traders analyze price action based on key levels from the previous trading session. By plotting the high, low, and mid-point (50%) of the prior day’s range, traders can assess potential market bias and directional tendencies for the current trading day.
Key Features:
Plots the previous day’s high (100%), low (0%), and intermediate levels (25%, 50%, 75%).
Allows users to customize line visibility, color, style, and width.
Helps traders identify potential support and resistance zones.
Provides a bias framework for determining whether price is more likely to target the previous high or low based on behavior around the 50% level.
Use Case:
This indicator is particularly useful for intraday and short-term traders who incorporate price action into their strategy.
If price trades above the 50% level and holds, it suggests a bullish bias, indicating that price may aim for the previous day's high.
If price trades below the 50% level and holds, it suggests a bearish bias, indicating that price may aim for the previous day's low.
The high and low levels can act as key support and resistance zones, where price may react or reverse.
How to Use:
Apply the indicator to your chart.
Observe how price interacts with the 50% level.
Use price behavior around these levels to establish a directional bias.
Adjust the line styles and colors to match your personal preference.
Disclaimer:
This indicator is a tool for market analysis and does not provide financial advice. Always perform your own analysis and risk management when trading.
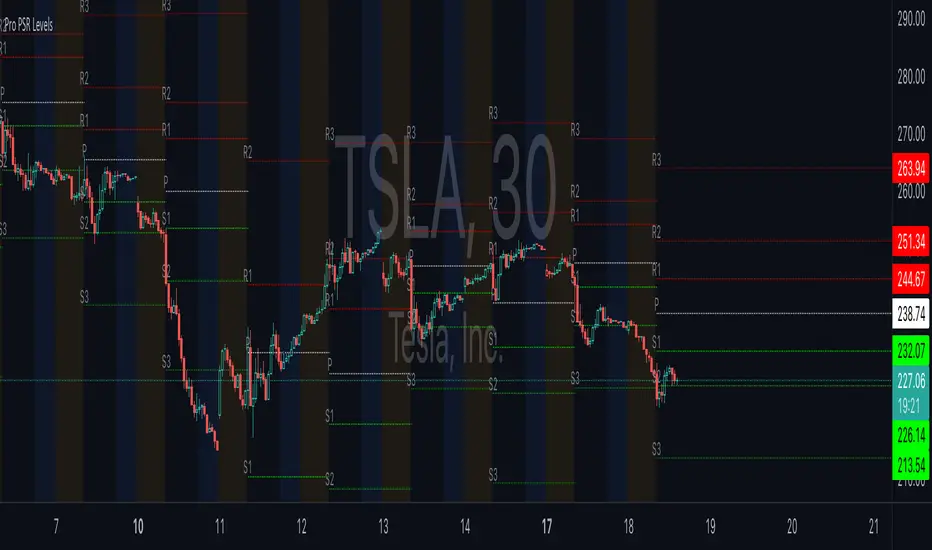
ReadyFor401ks Pivot / Support / ResistOverview
The ReadyFor401ks Pivot / Support / Resist indicator is a versatile tool designed to help traders identify key price levels—pivots, supports, and resistances—derived from a higher timeframe. This indicator recalculates levels based on a user-defined timeframe, providing you with a broader context for potential market reversals and continuations.
Key Features and Benefits
• Customizable Higher Timeframe:
You can select the frequency at which the levels are recalculated. For example, on a Daily chart, you might choose a 3-month timeframe to determine the pivot levels. This allows you to capture longer-term support and resistance zones that can be crucial for identifying major price reactions.
• Visual Clarity:
With toggles to show or hide the pivot, support, and resistance lines on the price chart, you have full control over the visual clutter on your chart. Additionally, you can choose to display the exact price values directly on the price scale, giving you an immediate reference as you trade.
• Enhanced Data Display:
In addition to price scale labels, the indicator offers an option to show the level values on the status line (data window). This feature is especially beneficial for traders who want to keep a close eye on these key levels without compromising chart space.
Practical Example
Imagine you’re analyzing a Daily chart while the indicator is set to recalculate levels on a 3-month frequency . Over a three-month period, the indicator determines a pivot point (P) along with three levels of resistance (R1, R2, R3) and support (S1, S2, S3). As price action unfolds, you may observe that:
• Price approaches the pivot level (P): This could indicate a potential reversal or a consolidation zone.
• Price bounces off a resistance level (e.g., R1): Signaling that the market is struggling to break higher.
• Price finds support at S1: Providing an opportunity to look for a bullish reversal.
By combining these insights with your own technical analysis, you can make more informed trading decisions based on significant levels that have been validated over a longer timeframe.
Conclusion
The ReadyFor401ks Pivot / Support / Resist indicator is ideal for traders who want to add an extra layer of confirmation to their trading strategies by identifying key price levels derived from higher timeframe data. Whether you’re a swing trader or a long-term investor, this tool helps you visualize crucial support and resistance areas, improving your market timing and risk management. Enjoy the enhanced clarity and flexibility this indicator offers on your TradingView charts!
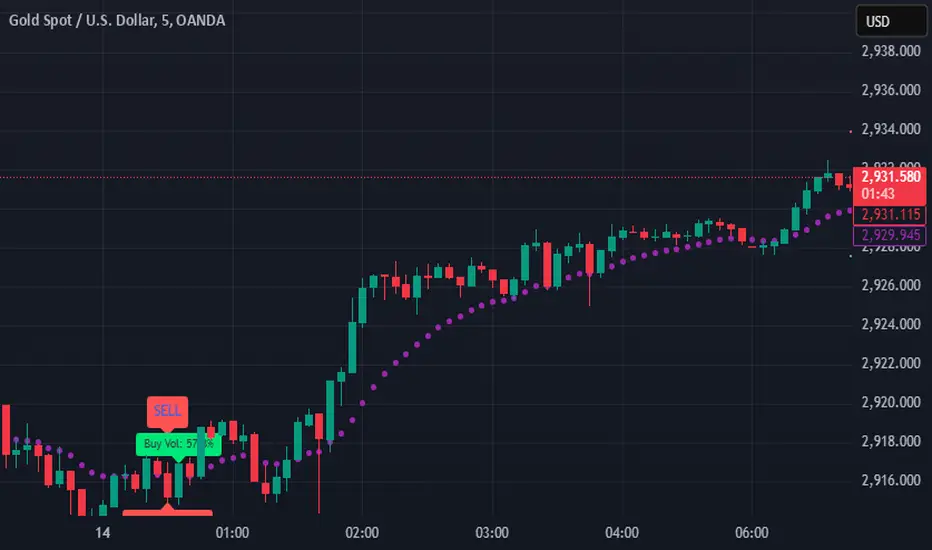
SIOVERSE EMA 15 with Buy/Sell Signals, Support & ResistanceThis Pine Script indicator is designed for TradingView and combines Exponential Moving Averages (EMAs), support and resistance levels, buy/sell signals, and volume percentage labels filtered by buy/sell conditions. It is a comprehensive tool for traders who want to analyze price trends, identify key levels, and make informed decisions based on volume and EMA crossovers.
Key Features of the Indicator
EMA 15 (Purple Dashed Line):
A 15-period Exponential Moving Average (EMA) is plotted on the chart as a dashed purple line.
This EMA helps traders identify short-term trends and potential entry/exit points.
Hidden EMA 21 and EMA 34:
The 21-period and 34-period EMAs are calculated but not displayed on the chart.
These EMAs are used to generate buy and sell signals based on crossovers.
Buy/Sell Signals:
Buy Signal: Occurs when the EMA 21 crosses above the EMA 34. A green "BUY" label is displayed below the candle.
Sell Signal: Occurs when the EMA 21 crosses below the EMA 34. A red "SELL" label is displayed above the candle.
These signals help traders identify potential trend reversals or continuations.
Support and Resistance Levels:
Support: The lowest price level over the last lookback_period candles, plotted as a green dashed horizontal line.
Resistance: The highest price level over the last lookback_period candles, plotted as a red dashed horizontal line.
These levels help traders identify key price zones for potential breakouts or reversals.
Volume Percentage Labels (Filtered by Buy/Sell Signals):
The volume percentage is calculated relative to the average volume over the last volume_lookback candles.
Buy Volume Label: When a buy signal occurs, a green label is displayed above the candle with the text "Buy Vol: X.XX%", where X.XX is the volume percentage.
Sell Volume Label: When a sell signal occurs, a red label is displayed below the candle with the text "Sell Vol: X.XX%", where X.XX is the volume percentage.
These labels help traders assess the strength of the buy/sell signals based on volume.
Alerts:
Alerts are triggered when buy or sell signals occur, notifying traders of potential trading opportunities.
Blackflag FTS (1H Trailing) + MSB-OB FibThis indicator combines a 1-hour trailing stop system with multi-timeframe Fibonacci retracement levels and ZigZag structure detection to assist traders in identifying trend direction and potential reversal zones.
Features:
✅ 1-Hour Trailing Stop: Uses an ATR-based trailing stop mechanism to track trend direction and dynamic support/resistance.
✅ Multi-Timeframe Approach: The trailing stop is calculated on the 1-hour timeframe, while the ZigZag and Fibonacci retracement levels are based on the 15-minute chart.
✅ ZigZag Structure Detection: Helps filter market swings and trend reversals dynamically.
✅ Fibonacci Levels (0.5 & 0.786): Key retracement levels to watch for price reactions.
✅ Alerts for Key Levels: Get notified when the price crosses important levels (1H trailing stop, Fib 0.5, Fib 0.786).
How It Works:
The trailing stop adapts dynamically based on ATR values and determines trend direction.
ZigZag detection filters out minor price movements to highlight major swing points.
Fibonacci levels are calculated based on ZigZag swings, helping traders spot potential reversal zones.
This tool is useful for trend-following traders, breakout traders, and Fibonacci-based strategies.
Let me know if you'd like any modifications! 🚀

Pivot Point+ Supertrend + EMA + Support/Resistance- LAXMANTAK98
Pivot Point Supertrend with EMA and Support/Resistance Indicator
This custom trading indicator combines the following key components to assist in market analysis and trade decision-making:
Pivot Points:
Pivot points are calculated based on a chosen price source (High, Low, Open, or Close). These levels are used to determine potential support and resistance zones.
Pivot Highs (Resistance) and Pivot Lows (Support) are plotted as labels on the chart for easy identification.
Supertrend Indicator:
The Supertrend is a trend-following indicator that helps to identify bullish or bearish trends.
It uses the Average True Range (ATR) to calculate dynamic support/resistance levels, with adjustable settings for ATR length and multiplier factor.
The trend direction is visually represented by green (bullish) and red (bearish) lines on the chart.
Exponential Moving Averages (EMA):
The indicator plots up to four EMAs with user-defined periods (e.g., 9, 21, 50, 200).
EMAs are commonly used to smooth out price data and identify trends over various timeframes.
Support and Resistance Levels:
Based on Pivot Points, support and resistance levels are plotted using crosses on the chart.
These levels indicate possible price reversal points, helping traders spot key zones for entry and exit.
Visual Alerts:
The indicator includes built-in alerts for trend changes and potential buy/sell signals based on the transition between uptrend and downtrend states.
This combined indicator allows traders to analyze trends, identify key levels for trading, and make more informed decisions by integrating Pivot Points, Supertrend, EMAs, and Support/Resistance in one cohesive system.

Dynamic Customizable 50% Line & Daily High/Low + True Day OpenA Unique Indicator for Precise Market-Level Analysis
This indicator is a fully integrated solution that automates complex market-level calculations and visualizations, offering traders a tool that goes beyond the functionality of existing open-source alternatives. By seamlessly combining several trading concepts into a single script, it delivers efficiency, accuracy, and customization that cater to both novice and professional traders.
Key Features: A Breakdown of What Makes It Unique
1. Adaptive Daily Highs and Lows
Automatically detects and plots daily high and low levels based on the selected time frame, dynamically updating in real time.
Features session-based adjustments, allowing traders to focus on levels that matter for specific trading sessions (e.g., London, New York).
Fully customizable styling, visibility, and alerts tailored to each trader’s preferences.
How It Works:
The indicator calculates daily high and low levels directly from price data, integrating session-specific time offsets to account for global trading hours. These levels provide traders with clear visual markers for key liquidity zones.
2. Automated ICT 50% Range Line
A pioneering implementation of ICT’s mid-range concept, this feature dynamically calculates and displays the midpoint of the daily range.
Offers traders a visual guide to identify premium and discount zones, aiding in determining market bias and potential trade setups.
How It Works:
The script calculates the range between the day’s high and low, dividing it by two to generate the midline. This line updates in real-time, ensuring that traders always see the most current premium and discount levels as price action evolves.
3. Dynamic Market Open Levels
Plots session opens (e.g., Asia, London, New York) and the True Day Open to provide actionable reference points for intra-day trading strategies.
Enhances precision in identifying liquidity shifts and aligning trades with institutional price movements.
How It Works:
The indicator uses predefined session times to calculate and display the opening levels for key trading sessions. It dynamically adjusts for time zones, ensuring accuracy regardless of the trader’s location.
4. Custom Watermark for Enhanced Visualization
Includes an optional watermark feature that allows users to display custom text on their charts.
Ideal for personalization, branding, or highlighting session notes without disrupting the clarity of the chart.
Why This Indicator Stands Out
First-to-Market Automation:
While the ICT 50% range line is a widely recognized concept, this is the first script to automate its calculation, combining it with other pivotal trading levels in a single tool.
All-in-One Functionality:
Unlike open-source alternatives that focus on individual features, this script integrates daily highs/lows, mid-range levels, session opens, and customizable watermarks into one cohesive system. The consolidation reduces the need for multiple indicators and ensures a clean, efficient chart setup.
Dynamic Customization:
Every feature can be adjusted to align with a trader’s strategy, time zone, or aesthetic preferences. This level of adaptability is unmatched in existing tools.
Proprietary Logic:
The indicator’s underlying calculations are built from scratch, leveraging advanced programming techniques to ensure accuracy and reliability. These proprietary methods differentiate it from similar open-source scripts.
How to Use This Indicator
Apply the Indicator:
Add it to your TradingView chart from the library.
Configure Settings:
Use the intuitive settings panel to adjust plotted levels, colors, styles, and visibility. Tailor the indicator to your trading strategy.
Incorporate into Analysis:
Combine the plotted levels with your preferred trading approach to identify liquidity zones, establish market bias, and pinpoint potential reversals or entries.
Stay Focused:
With all key levels automated and updated in real time, traders can focus on execution rather than manual plotting.
Originality and Justification for Closed Source
This script is closed-source due to its unique combination of features and proprietary logic that automates complex trading concepts like the ICT 50% range line and session-specific levels. Open-source alternatives lack this level of integration and customization, making this indicator a valuable and original contribution to the TradingView ecosystem.
What Sets It Apart from Open-Source Scripts?
Unlike open-source tools, this indicator doesn’t just replicate individual features—it enhances and integrates them into a seamless, all-in-one solution that offers traders a more efficient and effective way to analyze the market.

Multi Indicator SummaryPurpose: It calculates and displays bullish and bearish order blocks, key levels derived from recent price movements, which traders use to identify potential support and resistance areas.
Inputs: Users can customize the order block length, defining the range of price data used for calculations.
Logic: The script uses ta.lowest and ta.highest functions to compute order blocks based on specified periods for bullish and bearish trends.
Additional Levels: It identifies extra order blocks (bullish_below and bearish_above) to provide more context for deeper support or higher resistance.
Price Table: A visual table is created on the chart, showing the current price, bullish and bearish order blocks, and additional bearish levels above the current price.
Alerts: Alerts are triggered when the price crosses key order block levels, helping traders react to significant price movements.
Flexibility: The table dynamically updates based on the chart’s ticker and timeframe, ensuring it always reflects the latest data.
Bearish Above Price: Highlights the most recent bearish order block above the current price to inform traders about potential resistance areas.
Visualization: The clear table format aids quick decision-making by summarizing key levels in an accessible way.
Usability: This script is especially useful for intraday and swing traders seeking to integrate order block analysis into their strategies.

TLA20 - Multi-Session Box and Level ToolTLA20 is a highly customizable indicator designed to enhance intraday analysis by marking predefined trading sessions, key levels, and midpoints directly on your charts. With its versatile features, TLA20 is ideal for traders looking to visualize multiple time zones, daily price ranges, and historical reference levels efficiently.
Key Features:
Session Visualization: Mark up to three custom trading sessions with distinct start and end times, adjustable for different time zones and weekend inclusions.
Dynamic Highlights: Automatically draw session highs, lows, midlines, and open prices with options to extend beyond session bounds.
Custom Styling: Configure border colors, styles, and fill options for each session box to match your chart preferences.
Historical Levels: Highlight previous daily highs/lows, weekly highs/lows, and monthly highs/lows for improved context in your trading.
Intuitive Adjustments: Enable or disable each feature and customize settings for precise alignment with your trading strategy.
Use Cases:
Track trading sessions across different markets and time zones.
Identify key price levels like session midpoints and opens for entry/exit strategies.
Overlay historical levels to recognize potential support and resistance areas.
This indicator does not provide direct trading signals but serves as a robust tool for enhancing technical analysis.
Disclaimer: The script is provided “as is” without warranties of any kind. Always test on a demo account before applying in live markets.

Breaks and Retests - Free990Strategy Description: "Breaks and Retests - Free990"
The "Breaks and Retests - Free990" strategy is based on identifying breakout and retest opportunities for potential entries in both long and short trades. The idea is to detect price breakouts above resistance levels or below support levels, and subsequently identify retests that confirm the breakout levels. The strategy offers an automated approach to enter trades after a breakout followed by a retest, which serves as a confirmation of trend continuation.
Key Components:
Support and Resistance Detection:
The strategy calculates pivot levels based on historical price movements to define support and resistance areas. A lookback range is used to determine these key levels.
Breakouts and Retests:
The system identifies when a breakout occurs above a resistance level or below a support level.
It then waits for a retest of the previously broken level as confirmation, which is often a better entry opportunity.
Trade Direction Selection:
Users can choose between "Long Only," "Short Only," or "Both" directions for trading based on their market view.
Stop Loss and Trailing Stop:
An initial stop loss is placed at a defined percentage away from the entry.
The trailing stop loss is activated after the position gains a specified percentage in profit.
Long Entry:
A long entry is triggered if the price breaks above a resistance level and subsequently retests that level successfully.
The entry condition checks if the breakout was confirmed and if a retest was valid.
The long entry is only executed if the user-selected direction is either "Long Only" or "Both."
Short Entry:
A short entry is triggered if the price breaks below a support level and subsequently retests that level.
The short entry is only executed if the user-selected direction is either "Short Only" or "Both."
sell_condition checks whether the support has been broken and whether the retest condition is valid.
An initial stop loss is placed when the trade is opened to limit the risk if the trade moves against the position.
The stop loss is calculated based on a user-defined percentage (stop_loss_percent) of the entry price.
pinescript
Copy code
stop_loss_price := strategy.position_avg_price * (1 - stop_loss_percent / 100)
For long positions, the stop loss is placed below the entry price.
For short positions, the stop loss is placed above the entry price.
Trailing Stop:
When a position achieves a certain profit threshold (profit_threshold_percent), the trailing stop mechanism is activated.
For long positions, the trailing stop follows the highest price reached, ensuring that some profit is locked in if the price reverses.
For short positions, the trailing stop follows the lowest price reached.
Code Logic for Trailing Stop:
Exit Execution:
The strategy exits the position when the price hits the calculated stop loss level.
This includes both the initial stop loss and the trailing stop that adjusts as the trade progresses.
Code Logic for Exit:
Summary:
Breaks and Retests - Free990 uses support and resistance levels to identify breakouts, followed by retests for confirmation.
Entry Points: Triggered when a breakout is confirmed and a retest occurs, for both long and short trades.
Exit Points:
Initial Stop Loss: Limits risk for both long and short trades.
Trailing Stop Loss: Locks in profits as the price moves in favor of the position.
This strategy aims to capture the momentum after breakouts and minimize losses through effective use of stop loss and trailing stops. It gives the flexibility of selecting trade direction and ensures trades are taken with confirmation through the retest, which helps to reduce false breakouts.
Original Code by @HoanGhetti

Support/Resistance Strength [UAlgo]The Support/Resistance Strength indicator is a tool designed for traders seeking a precise understanding of key support and resistance levels in the market. This tool dynamically identifies and visualizes support and resistance zones based on pivot points and strength criteria, providing traders with actionable insights for better decision-making.
By incorporating features such as ATR-based or percentage-based channel calculations, customizable strength thresholds, and intuitive visualization of key levels, the indicator caters to traders of various skill levels and strategies. It also adapts dynamically to market conditions, allowing users to identify frequently tested zones with minimal manual input.
🔶 Key Features
Dynamic Support and Resistance Zones
Automatically detects significant support and resistance levels using pivot high and low calculations.
Offers ATR-based or percentage-based channel customization to cater to diverse trading styles.
Customizable Parameters
Lookback period for pivot calculations, strength threshold, and maximum stored pivots are fully adjustable.
Display options for showing specific numbers of recent support/resistance lines.
Intuitive Visualization
Highlights key support and resistance levels with color-coded lines and labels.
Includes percentage deviation from the current price for quick assessment.
Interactive Updates
Continuously updates support and resistance levels to reflect changing market dynamics.
Displays pivot points visually for enhanced clarity.
Can be used effectively on various timeframes, from intraday to daily and weekly charts.
🔶 Interpreting the Indicator
Identifying Key Levels
Support levels are indicated by green (lime) lines and resistance levels by red lines. The transparency of colors is adjustable for visual preference.
Labels display the exact price level and the percentage difference from the current price.
Strength Threshold
The "Minimum S/R Strength" parameter defines how frequently a level must be tested to be considered significant.
Higher strength values indicate zones that have been tested more frequently, suggesting stronger support or resistance.
Pivot Points
The indicator marks pivot high and low points on the chart to provide a visual representation of the calculated levels.
Dynamic Updates
The indicator adapts to the most recent price action. If the price moves above a resistance level or below a support level, the color of the lines and labels will dynamically change to reflect the current price positioning.
🔶 Disclaimer
Use with Caution: This indicator is provided for educational and informational purposes only and should not be considered as financial advice. Users should exercise caution and perform their own analysis before making trading decisions based on the indicator's signals.
Not Financial Advice: The information provided by this indicator does not constitute financial advice, and the creator (UAlgo) shall not be held responsible for any trading losses incurred as a result of using this indicator.
Backtesting Recommended: Traders are encouraged to backtest the indicator thoroughly on historical data before using it in live trading to assess its performance and suitability for their trading strategies.
Risk Management: Trading involves inherent risks, and users should implement proper risk management strategies, including but not limited to stop-loss orders and position sizing, to mitigate potential losses.
No Guarantees: The accuracy and reliability of the indicator's signals cannot be guaranteed, as they are based on historical price data and past performance may not be indicative of future results.

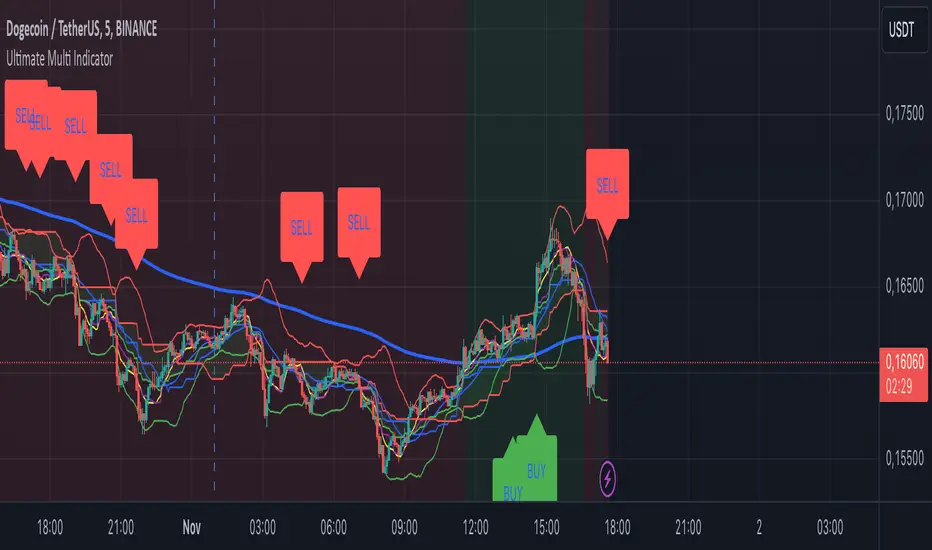
Ultimate Multi Indicator - by SachaThe Ultimate Multi Indicator: The Ultimate Guide To Profit
This custom indicator, the Ultimate Multi Indicator , integrates multiple trading indicators to have powerful buy and sell signals. I combined MACD, EMA, RSI, Bollinger Bands, Volume Profile, and Ichimoku Cloud indicators to help traders analyze both short-term and long-term price movements.
Key Components and How to Use Them
- MACD (Moving Average Convergence Divergence):
- Use for trend direction and potentiality of reversals.
- The blue line (MACD Line) crossing above the orange line (Signal Line) indicates a bullish reversal; the opposite signals a bearish reversal.
- Watch for crossovers to confirm the direction of smaller price movements.
- 200 EMA (Long) (Exponential Moving Average):
- Use to indicate a long-term trend direction.
- If the price is above the 200 EMA, the market is in an uptrend; below it suggests a downtrend.
- The chart’s background color shifts subtly green (uptrend) or red (downtrend) depending on the EMA's relative position.
- RSI (Relative Strength Index):
- Tracks momentum and overbought/oversold levels.
- RSI over 70 signifies overbought conditions; under 30 indicates oversold.
- Look for RSI turning points around these levels to identify potential reversals.
- Bollinger Bands :
- The price touching or crossing the upper Bollinger Band may mean overbought conditions are filled, while a touch at the lower band indicates oversold.
- Bollinger Band interactions often align with key reversal points, especially when combined with other signals.
- Volume Profile :
- A yellow VP line on the chart represents significant trading volume occurred.
- This line can be used as both a support and resistance level, and especially during consolidations or trend changes.
- Ichimoku Cloud :
- Identifies support/resistance levels and trend direction.
- Green and red cloud regions visually show if the price is above (bullish) or below (bearish) key levels.
- Price above the cloud (green) confirms a bullish market, while below (red) signals bearish.
Signal Conditions and Visualization
- Buy Signals :
- This is triggered right away when MACD crosses up, RSI is oversold, or price touches the lower Bollinger Band, provided price is above both the Ichimoku Cloud and the 200 EMA.
- A green “BUY” label appears below the bar, suggesting a potential entry.
- Sell Signals :
- This signal is generated when MACD crosses down, RSI is overbought, or price touches the upper Bollinger Band, and price is below the Ichimoku Cloud and the 200 EMA.
- A red “SELL” label is shown above the bar, indicating a potential exit.
Tips & Tricks
- Confirm Signals : Use multiple signals to confirm entries and exits. For example, if both the MACD and RSI align with the Ichimoku Cloud direction, the trade setup is stronger.
- Trend Directions : Only take buy signals if the price is above the 200 EMA, and sell signals if it is below, aligning trades with the overall trend.
- Adjust for Volatility : In high-volatility markets, especially in the crypto markets, pay close attention to the Bollinger Bands for breakout potential.
- Ichimoku as a Trend Guide : Use the Ichimoku Cloud as a guide for long-term support and resistance levels, especially for swing trades.
This multi-layered indicator gives a balanced blend of short-term signals and long-term trend insights, making it a versatile tool for day trading, swing trading, or even longer-term analysis.
Remember that indicators that will make you rich instantly don't exist. To expect minimum profit from them, you shouldn't trade all you have at the same time but only trade with the money you can afford to lose.
After that being said, I wish you traders luck with the Ultimate Multi Indicator!
Trading IQ - ICT LibraryLibrary "ICTlibrary"
Used to calculate various ICT related price levels and strategies. An ongoing project.
Hello Coders!
This library is meant for sourcing ICT related concepts. While some functions might generate more output than you require, you can specify "Lite Mode" as "true" in applicable functions to slim down necessary inputs.
isLastBar(userTF)
Identifies the last bar on the chart before a timeframe change
Parameters:
userTF (simple int) : the timeframe you wish to calculate the last bar for, must be converted to integer using 'timeframe.in_seconds()'
Returns: bool true if bar on chart is last bar of higher TF, dalse if bar on chart is not last bar of higher TF
necessaryData(atrTF)
returns necessaryData UDT for historical data access
Parameters:
atrTF (float) : user-selected timeframe ATR value.
Returns: logZ. log return Z score, used for calculating order blocks.
method gradBoxes(gradientBoxes, idColor, timeStart, bottom, top, rightCoordinate)
creates neon like effect for box drawings
Namespace types: array
Parameters:
gradientBoxes (array) : an array.new() to store the gradient boxes
idColor (color)
timeStart (int) : left point of box
bottom (float) : bottom of box price point
top (float) : top of box price point
rightCoordinate (int) : right point of box
Returns: void
checkIfTraded(tradeName)
checks if recent trade is of specific name
Parameters:
tradeName (string)
Returns: bool true if recent trade id matches target name, false otherwise
checkIfClosed(tradeName)
checks if recent closed trade is of specific name
Parameters:
tradeName (string)
Returns: bool true if recent closed trade id matches target name, false otherwise
IQZZ(atrMult, finalTF)
custom ZZ to quickly determine market direction.
Parameters:
atrMult (float) : an atr multiplier used to determine the required price move for a ZZ direction change
finalTF (string) : the timeframe used for the atr calcuation
Returns: dir market direction. Up => 1, down => -1
method drawBos(id, startPoint, getKeyPointTime, getKeyPointPrice, col, showBOS, isUp)
calculates and draws Break Of Structure
Namespace types: array
Parameters:
id (array)
startPoint (chart.point)
getKeyPointTime (int) : the actual time of startPoint, simplystartPoint.time
getKeyPointPrice (float) : the actual time of startPoint, simplystartPoint.price
col (color) : color of the BoS line / label
showBOS (bool) : whether to show label/line. This function still calculates internally for other ICT related concepts even if not drawn.
isUp (bool) : whether BoS happened during price increase or price decrease.
Returns: void
method drawMSS(id, startPoint, getKeyPointTime, getKeyPointPrice, col, showMSS, isUp, upRejections, dnRejections, highArr, lowArr, timeArr, closeArr, openArr, atrTFarr, upRejectionsPrices, dnRejectionsPrices)
calculates and draws Market Structure Shift. This data is also used to calculate Rejection Blocks.
Namespace types: array
Parameters:
id (array)
startPoint (chart.point)
getKeyPointTime (int) : the actual time of startPoint, simplystartPoint.time
getKeyPointPrice (float) : the actual time of startPoint, simplystartPoint.price
col (color) : color of the MSS line / label
showMSS (bool) : whether to show label/line. This function still calculates internally for other ICT related concepts even if not drawn.
isUp (bool) : whether MSS happened during price increase or price decrease.
upRejections (array)
dnRejections (array)
highArr (array) : array containing historical highs, should be taken from the UDT "necessaryData" defined above
lowArr (array) : array containing historical lows, should be taken from the UDT "necessaryData" defined above
timeArr (array) : array containing historical times, should be taken from the UDT "necessaryData" defined above
closeArr (array) : array containing historical closes, should be taken from the UDT "necessaryData" defined above
openArr (array) : array containing historical opens, should be taken from the UDT "necessaryData" defined above
atrTFarr (array) : array containing historical atr values (of user-selected TF), should be taken from the UDT "necessaryData" defined above
upRejectionsPrices (array) : array containing up rejections prices. Is sorted and used to determine selective looping for invalidations.
dnRejectionsPrices (array) : array containing down rejections prices. Is sorted and used to determine selective looping for invalidations.
Returns: void
method getTime(id, compare, timeArr)
gets time of inputted price (compare) in an array of data
this is useful when the user-selected timeframe for ICT concepts is greater than the chart's timeframe
Namespace types: array
Parameters:
id (array) : the array of data to search through, to find which index has the same value as "compare"
compare (float) : the target data point to find in the array
timeArr (array) : array of historical times
Returns: the time that the data point in the array was recorded
method OB(id, highArr, signArr, lowArr, timeArr, sign)
store bullish orderblock data
Namespace types: array
Parameters:
id (array)
highArr (array) : array of historical highs
signArr (array) : array of historical price direction "math.sign(close - open)"
lowArr (array) : array of historical lows
timeArr (array) : array of historical times
sign (int) : orderblock direction, -1 => bullish, 1 => bearish
Returns: void
OTEstrat(OTEstart, future, closeArr, highArr, lowArr, timeArr, longOTEPT, longOTESL, longOTElevel, shortOTEPT, shortOTESL, shortOTElevel, structureDirection, oteLongs, atrTF, oteShorts)
executes the OTE strategy
Parameters:
OTEstart (chart.point)
future (int) : future time point for drawings
closeArr (array) : array of historical closes
highArr (array) : array of historical highs
lowArr (array) : array of historical lows
timeArr (array) : array of historical times
longOTEPT (string) : user-selected long OTE profit target, please create an input.string() for this using the example below
longOTESL (int) : user-selected long OTE stop loss, please create an input.string() for this using the example below
longOTElevel (float) : long entry price of selected retracement ratio for OTE
shortOTEPT (string) : user-selected short OTE profit target, please create an input.string() for this using the example below
shortOTESL (int) : user-selected short OTE stop loss, please create an input.string() for this using the example below
shortOTElevel (float) : short entry price of selected retracement ratio for OTE
structureDirection (string) : current market structure direction, this should be "Up" or "Down". This is used to cancel pending orders if market structure changes
oteLongs (bool) : input.bool() for whether OTE longs can be executed
atrTF (float) : atr of the user-seleceted TF
oteShorts (bool) : input.bool() for whether OTE shorts can be executed
@exampleInputs
oteLongs = input.bool(defval = false, title = "OTE Longs", group = "Optimal Trade Entry")
longOTElevel = input.float(defval = 0.79, title = "Long Entry Retracement Level", options = , group = "Optimal Trade Entry")
longOTEPT = input.string(defval = "-0.5", title = "Long TP", options = , group = "Optimal Trade Entry")
longOTESL = input.int(defval = 0, title = "How Many Ticks Below Swing Low For Stop Loss", group = "Optimal Trade Entry")
oteShorts = input.bool(defval = false, title = "OTE Shorts", group = "Optimal Trade Entry")
shortOTElevel = input.float(defval = 0.79, title = "Short Entry Retracement Level", options = , group = "Optimal Trade Entry")
shortOTEPT = input.string(defval = "-0.5", title = "Short TP", options = , group = "Optimal Trade Entry")
shortOTESL = input.int(defval = 0, title = "How Many Ticks Above Swing Low For Stop Loss", group = "Optimal Trade Entry")
Returns: void (0)
displacement(logZ, atrTFreg, highArr, timeArr, lowArr, upDispShow, dnDispShow, masterCoords, labelLevels, dispUpcol, rightCoordinate, dispDncol, noBorders)
calculates and draws dispacements
Parameters:
logZ (float) : log return of current price, used to determine a "significant price move" for a displacement
atrTFreg (float) : atr of user-seleceted timeframe
highArr (array) : array of historical highs
timeArr (array) : array of historical times
lowArr (array) : array of historical lows
upDispShow (int) : amount of historical upside displacements to show
dnDispShow (int) : amount of historical downside displacements to show
masterCoords (map) : a map to push the most recent displacement prices into, useful for having key levels in one data structure
labelLevels (string) : used to determine label placement for the displacement, can be inside box, outside box, or none, example below
dispUpcol (color) : upside displacement color
rightCoordinate (int) : future time for displacement drawing, best is "last_bar_time"
dispDncol (color) : downside displacement color
noBorders (bool) : input.bool() to remove box borders, example below
@exampleInputs
labelLevels = input.string(defval = "Inside" , title = "Box Label Placement", options = )
noBorders = input.bool(defval = false, title = "No Borders On Levels")
Returns: void
method getStrongLow(id, startIndex, timeArr, lowArr, strongLowPoints)
unshift strong low data to array id
Namespace types: array
Parameters:
id (array)
startIndex (int) : the starting index for the timeArr array of the UDT "necessaryData".
this point should start from at least 1 pivot prior to find the low before an upside BoS
timeArr (array) : array of historical times
lowArr (array) : array of historical lows
strongLowPoints (array) : array of strong low prices. Used to retrieve highest strong low price and see if need for
removal of invalidated strong lows
Returns: void
method getStrongHigh(id, startIndex, timeArr, highArr, strongHighPoints)
unshift strong high data to array id
Namespace types: array
Parameters:
id (array)
startIndex (int) : the starting index for the timeArr array of the UDT "necessaryData".
this point should start from at least 1 pivot prior to find the high before a downside BoS
timeArr (array) : array of historical times
highArr (array) : array of historical highs
strongHighPoints (array)
Returns: void
equalLevels(highArr, lowArr, timeArr, rightCoordinate, equalHighsCol, equalLowsCol, liteMode)
used to calculate recent equal highs or equal lows
Parameters:
highArr (array) : array of historical highs
lowArr (array) : array of historical lows
timeArr (array) : array of historical times
rightCoordinate (int) : a future time (right for boxes, x2 for lines)
equalHighsCol (color) : user-selected color for equal highs drawings
equalLowsCol (color) : user-selected color for equal lows drawings
liteMode (bool) : optional for a lite mode version of an ICT strategy. For more control over drawings leave as "True", "False" will apply neon effects
Returns: void
quickTime(timeString)
used to quickly determine if a user-inputted time range is currently active in NYT time
Parameters:
timeString (string) : a time range
Returns: true if session is active, false if session is inactive
macros(showMacros, noBorders)
used to calculate and draw session macros
Parameters:
showMacros (bool) : an input.bool() or simple bool to determine whether to activate the function
noBorders (bool) : an input.bool() to determine whether the box anchored to the session should have borders
Returns: void
po3(tf, left, right, show)
use to calculate HTF po3 candle
@tip only call this function on "barstate.islast"
Parameters:
tf (simple string)
left (int) : the left point of the candle, calculated as bar_index + left,
right (int) : :the right point of the candle, calculated as bar_index + right,
show (bool) : input.bool() whether to show the po3 candle or not
Returns: void
silverBullet(silverBulletStratLong, silverBulletStratShort, future, userTF, H, L, H2, L2, noBorders, silverBulletLongTP, historicalPoints, historicalData, silverBulletLongSL, silverBulletShortTP, silverBulletShortSL)
used to execute the Silver Bullet Strategy
Parameters:
silverBulletStratLong (simple bool)
silverBulletStratShort (simple bool)
future (int) : a future time, used for drawings, example "last_bar_time"
userTF (simple int)
H (float) : the high price of the user-selected TF
L (float) : the low price of the user-selected TF
H2 (float) : the high price of the user-selected TF
L2 (float) : the low price of the user-selected TF
noBorders (bool) : an input.bool() used to remove the borders from box drawings
silverBulletLongTP (series silverBulletLevels)
historicalPoints (array)
historicalData (necessaryData)
silverBulletLongSL (series silverBulletLevels)
silverBulletShortTP (series silverBulletLevels)
silverBulletShortSL (series silverBulletLevels)
Returns: void
method invalidFVGcheck(FVGarr, upFVGpricesSorted, dnFVGpricesSorted)
check if existing FVGs are still valid
Namespace types: array
Parameters:
FVGarr (array)
upFVGpricesSorted (array) : an array of bullish FVG prices, used to selective search through FVG array to remove invalidated levels
dnFVGpricesSorted (array) : an array of bearish FVG prices, used to selective search through FVG array to remove invalidated levels
Returns: void (0)
method drawFVG(counter, FVGshow, FVGname, FVGcol, data, masterCoords, labelLevels, borderTransp, liteMode, rightCoordinate)
draws FVGs on last bar
Namespace types: map
Parameters:
counter (map) : a counter, as map, keeping count of the number of FVGs drawn, makes sure that there aren't more FVGs drawn
than int FVGshow
FVGshow (int) : the number of FVGs to show. There should be a bullish FVG show and bearish FVG show. This function "drawFVG" is used separately
for bearish FVG and bullish FVG.
FVGname (string) : the name of the FVG, "FVG Up" or "FVG Down"
FVGcol (color) : desired FVG color
data (FVG)
masterCoords (map) : a map containing the names and price points of key levels. Used to define price ranges.
labelLevels (string) : an input.string with options "Inside", "Outside", "Remove". Determines whether FVG labels should be inside box, outside,
or na.
borderTransp (int)
liteMode (bool)
rightCoordinate (int) : the right coordinate of any drawings. Must be a time point.
Returns: void
invalidBlockCheck(bullishOBbox, bearishOBbox, userTF)
check if existing order blocks are still valid
Parameters:
bullishOBbox (array) : an array declared using the UDT orderBlock that contains bullish order block related data
bearishOBbox (array) : an array declared using the UDT orderBlock that contains bearish order block related data
userTF (simple int)
Returns: void (0)
method lastBarRejections(id, rejectionColor, idShow, rejectionString, labelLevels, borderTransp, liteMode, rightCoordinate, masterCoords)
draws rejectionBlocks on last bar
Namespace types: array
Parameters:
id (array) : the array, an array of rejection block data declared using the UDT rejection block
rejectionColor (color) : the desired color of the rejection box
idShow (int)
rejectionString (string) : the desired name of the rejection blocks
labelLevels (string) : an input.string() to determine if labels for the block should be inside the box, outside, or none.
borderTransp (int)
liteMode (bool) : an input.bool(). True = neon effect, false = no neon.
rightCoordinate (int) : atime for the right coordinate of the box
masterCoords (map) : a map that stores the price of key levels and assigns them a name, used to determine price ranges
Returns: void
method OBdraw(id, OBshow, BBshow, OBcol, BBcol, bullishString, bearishString, isBullish, labelLevels, borderTransp, liteMode, rightCoordinate, masterCoords)
draws orderblocks and breaker blocks for data stored in UDT array()
Namespace types: array
Parameters:
id (array) : the array, an array of order block data declared using the UDT orderblock
OBshow (int) : the number of order blocks to show
BBshow (int) : the number of breaker blocks to show
OBcol (color) : color of order blocks
BBcol (color) : color of breaker blocks
bullishString (string) : the title of bullish blocks, which is a regular bullish orderblock or a bearish orderblock that's converted to breakerblock
bearishString (string) : the title of bearish blocks, which is a regular bearish orderblock or a bullish orderblock that's converted to breakerblock
isBullish (bool) : whether the array contains bullish orderblocks or bearish orderblocks. If bullish orderblocks,
the array will naturally contain bearish BB, and if bearish OB, the array will naturally contain bullish BB
labelLevels (string) : an input.string() to determine if labels for the block should be inside the box, outside, or none.
borderTransp (int)
liteMode (bool) : an input.bool(). True = neon effect, false = no neon.
rightCoordinate (int) : atime for the right coordinate of the box
masterCoords (map) : a map that stores the price of key levels and assigns them a name, used to determine price ranges
Returns: void
FVG
UDT for FVG calcualtions
Fields:
H (series float) : high price of user-selected timeframe
L (series float) : low price of user-selected timeframe
direction (series string) : FVG direction => "Up" or "Down"
T (series int) : => time of bar on user-selected timeframe where FVG was created
fvgLabel (series label) : optional label for FVG
fvgLineTop (series line) : optional line for top of FVG
fvgLineBot (series line) : optional line for bottom of FVG
fvgBox (series box) : optional box for FVG
labelLine
quickly pair a line and label together as UDT
Fields:
lin (series line) : Line you wish to pair with label
lab (series label) : Label you wish to pair with line
orderBlock
UDT for order block calculations
Fields:
orderBlockData (array) : array containing order block x and y points
orderBlockBox (series box) : optional order block box
vioCount (series int) : = 0 violation count of the order block. 0 = Order Block, 1 = Breaker Block
traded (series bool)
status (series string) : = "OB" status == "OB" => Level is order block. status == "BB" => Level is breaker block.
orderBlockLab (series label) : options label for the order block / breaker block.
strongPoints
UDT for strong highs and strong lows
Fields:
price (series float) : price of the strong high or strong low
timeAtprice (series int) : time of the strong high or strong low
strongPointLabel (series label) : optional label for strong point
strongPointLine (series line) : optional line for strong point
overlayLine (series line) : optional lines for strong point to enhance visibility
overlayLine2 (series line) : optional lines for strong point to enhance visibility
displacement
UDT for dispacements
Fields:
highPrice (series float) : high price of displacement
lowPrice (series float) : low price of displacement
timeAtPrice (series int) : time of bar where displacement occurred
displacementBox (series box) : optional box to draw displacement
displacementLab (series label) : optional label for displacement
po3data
UDT for po3 calculations
Fields:
dHigh (series float) : higher timeframe high price
dLow (series float) : higher timeframe low price
dOpen (series float) : higher timeframe open price
dClose (series float) : higher timeframe close price
po3box (series box) : box to draw po3 candle body
po3line (array) : line array to draw po3 wicks
po3Labels (array) : label array to label price points of po3 candle
macros
UDT for session macros
Fields:
sessions (array) : Array of sessions, you can populate this array using the "quickTime" function located above "export macros".
prices (matrix) : Matrix of session data -> open, high, low, close, time
sessionTimes (array) : Array of session names. Pairs with array sessions.
sessionLines (matrix) : Optional array for sesion drawings.
OTEtimes
UDT for data storage and drawings associated with OTE strategy
Fields:
upTimes (array) : time of highest point before trade is taken
dnTimes (array) : time of lowest point before trade is taken
tpLineLong (series line) : line to mark tp level long
tpLabelLong (series label) : label to mark tp level long
slLineLong (series line) : line to mark sl level long
slLabelLong (series label) : label to mark sl level long
tpLineShort (series line) : line to mark tp level short
tpLabelShort (series label) : label to mark tp level short
slLineShort (series line) : line to mark sl level short
slLabelShort (series label) : label to mark sl level short
sweeps
UDT for data storage and drawings associated with liquidity sweeps
Fields:
upSweeps (matrix) : matrix containing liquidity sweep price points and time points for up sweeps
dnSweeps (matrix) : matrix containing liquidity sweep price points and time points for down sweeps
upSweepDrawings (array) : optional up sweep box array. Pair the size of this array with the rows or columns,
dnSweepDrawings (array) : optional up sweep box array. Pair the size of this array with the rows or columns,
raidExitDrawings
UDT for drawings associated with the Liquidity Raid Strategy
Fields:
tpLine (series line) : tp line for the liquidity raid entry
tpLabel (series label) : tp label for the liquidity raid entry
slLine (series line) : sl line for the liquidity raid entry
slLabel (series label) : sl label for the liquidity raid entry
m2022
UDT for data storage and drawings associated with the Model 2022 Strategy
Fields:
mTime (series int) : time of the FVG where entry limit order is placed
mIndex (series int) : array index of FVG where entry limit order is placed. This requires an array of FVG data, which is defined above.
mEntryDistance (series float) : the distance of the FVG to the 50% range. M2022 looks for the fvg closest to 50% mark of range.
mEntry (series float) : the entry price for the most eligible fvg
fvgHigh (series float) : the high point of the eligible fvg
fvgLow (series float) : the low point of the eligible fvg
longFVGentryBox (series box) : long FVG box, used to draw the eligible FVG
shortFVGentryBox (series box) : short FVG box, used to draw the eligible FVG
line50P (series line) : line used to mark 50% of the range
line100P (series line) : line used to mark 100% (top) of the range
line0P (series line) : line used to mark 0% (bottom) of the range
label50P (series label) : label used to mark 50% of the range
label100P (series label) : label used to mark 100% (top) of the range
label0P (series label) : label used to mark 0% (bottom) of the range
sweepData (array)
silverBullet
UDT for data storage and drawings associated with the Silver Bullet Strategy
Fields:
session (series bool)
sessionStr (series string) : name of the session for silver bullet
sessionBias (series string)
sessionHigh (series float) : = high high of session // use math.max(silverBullet.sessionHigh, high)
sessionLow (series float) : = low low of session // use math.min(silverBullet.sessionLow, low)
sessionFVG (series float) : if applicable, the FVG created during the session
sessionFVGdraw (series box) : if applicable, draw the FVG created during the session
traded (series bool)
tp (series float) : tp of trade entered at the session FVG
sl (series float) : sl of trade entered at the session FVG
sessionDraw (series box) : optional draw session with box
sessionDrawLabel (series label) : optional label session with label
silverBulletDrawings
UDT for trade exit drawings associated with the Silver Bullet Strategy
Fields:
tpLine (series line) : tp line drawing for strategy
tpLabel (series label) : tp label drawing for strategy
slLine (series line) : sl line drawing for strategy
slLabel (series label) : sl label drawing for strategy
unicornModel
UDT for data storage and drawings associated with the Unicorn Model Strategy
Fields:
hPoint (chart.point)
hPoint2 (chart.point)
hPoint3 (chart.point)
breakerBlock (series box) : used to draw the breaker block required for the Unicorn Model
FVG (series box) : used to draw the FVG required for the Unicorn model
topBlock (series float) : price of top of breaker block, can be used to detail trade entry
botBlock (series float) : price of bottom of breaker block, can be used to detail trade entry
startBlock (series int) : start time of the breaker block, used to set the "left = " param for the box
includes (array) : used to store the time of the breaker block, or FVG, or the chart point sequence that setup the Unicorn Model.
entry (series float) : // eligible entry price, for longs"math.max(topBlock, FVG.get_top())",
tpLine (series line) : optional line to mark PT
tpLabel (series label) : optional label to mark PT
slLine (series line) : optional line to mark SL
slLabel (series label) : optional label to mark SL
rejectionBlocks
UDT for data storage and drawings associated with rejection blocks
Fields:
rejectionPoint (chart.point)
bodyPrice (series float) : candle body price closest to the rejection point, for "Up" rejections => math.max(open, close),
rejectionBox (series box) : optional box drawing of the rejection block
rejectionLabel (series label) : optional label for the rejection block
equalLevelsDraw
UDT for data storage and drawings associated with equal highs / equal lows
Fields:
connector (series line) : single line placed at the first high or low, y = avgerage of distinguished equal highs/lows
connectorLab (series label) : optional label to be placed at the highs or lows
levels (array) : array containing the equal highs or lows prices
times (array) : array containing the equal highs or lows individual times
startTime (series int) : the time of the first high or low that forms a sequence of equal highs or lows
radiate (array) : options label to "radiate" the label in connector lab. Can be used for anything
necessaryData
UDT for data storage of historical price points.
Fields:
highArr (array) : array containing historical high points
lowArr (array) : array containing historical low points
timeArr (array) : array containing historical time points
logArr (array) : array containing historical log returns
signArr (array) : array containing historical price directions
closeArr (array) : array containing historical close points
binaryTimeArr (array) : array containing historical time points, uses "push" instead of "unshift" to allow for binary search
binaryCloseArr (array) : array containing historical close points, uses "push" instead of "unshift" to allow the correct
binaryOpenArr (array) : array containing historical optn points, uses "push" instead of "unshift" to allow the correct
atrTFarr (array) : array containing historical user-selected TF atr points
openArr (array) : array containing historical open points

Premium & Discount Delta Volume [BigBeluga]Premium & Discount Delta Volume is an advanced volume-based tool that helps traders identify zones of market imbalances by using the concepts of premium and discount pricing, commonly taught by ICT trader. It calculates and highlights periods where the market is trading at a premium (selling pressure is stronger) or a discount (buying pressure is stronger) and dynamically plots these zones over time. The indicator also calculates delta volume between buying and selling within these zones, showing shifts in market sentiment and potential areas for reversals or continuations.
🔵 IDEA
The Premium & Discount Delta Volume indicator is rooted in the ICT (Inner Circle Trader) concept of premium and discount zones. This concept divides the price action into two key zones:
Premium Zone : This area is where the market is trading at a level where sellers dominate, leading to more selling pressure. The idea is that the price is overvalued, and a potential drop could occur as the market reverts to a balanced state.
Discount Zone : This area is where the market is undervalued, with buyers dominating and applying upward pressure. Prices in this area often indicate opportunities to buy into strength as the market moves back to equilibrium.
At the core of the indicator is the delta volume, which measures the difference between buying and selling pressure within the premium and discount zones. When the delta volume is negative, it signals a downtrend with more selling pressure, while a positive delta volume signals an uptrend with more buying pressure. These zones and their associated delta values update dynamically, providing traders with real-time insights into market strength and potential price reversals.
The equilibrium in the middle of the premium and discount zones represents the balance point between buyers and sellers. When price moves away from equilibrium, it either enters the premium zone (potentially overbought) or the discount zone (potentially oversold), helping traders make more informed decisions based on volume and price structure.
🔵 KEY FEATURES & USAGE
Premium & Discount Zones:
The indicator automatically identifies and plots premium and discount zones on the chart. Premium zones count only negative (selling) volume, while discount zones count only positive (buying) volume. These zones are key areas of interest for identifying potential price reversals or continuations based on volume pressure.
Dynamic Delta Volume Calculation:
The indicator calculates delta volume between the premium and discount zones, showing the imbalance between buyers and sellers. A positive delta volume inside the discount zone suggests strong buying pressure, while a negative delta inside the premium zone suggests strong selling pressure. This helps traders quickly identify trends or market exhaustion.
Up Trend:
Down Trend:
Real-time Updates & Equilibrium Line:
The zones update dynamically every 100 bars or after price crosses them, ensuring that traders always have the most relevant market data. The equilibrium line in the middle of the zones helps traders gauge whether the market is balanced or moving into overbought (premium) or oversold (discount) territory.
Macro and Local Period Calculations:
The indicator allows traders to customize two different periods for analysis: a smaller lookback period (e.g., 50 bars) for short-term price action and a macro period (e.g., 200 bars) for larger trends. Each period has its own premium and discount zones, allowing for a multi-timeframe view of market strength.
Macro:
Both:
Color-coded background for Volume Pressure:
The background color of the smaller period premium and discount box changes based on delta volume. A positive delta turns the background blue, indicating higher buy pressure, while a negative delta turns the background red, signaling higher sell pressure.
🔵 CUSTOMIZATION
Toggle Premium & Discount: Traders can choose to display support and resistance levels based on the high and low points of the premium and discount zones.
Premium & Discount Lookback Period: Traders can adjust the lookback period to define the length of price action to be analyzed for premium and discount zones. A shorter period focuses on more recent market activity, while a longer period provides a broader view of trends.
Macro Highs/Lows Period: The indicator also offers a macro lookback period for identifying larger market trends and key levels of buying or selling volume.
Toggle Macro Levels: Macro levels help identify long-term price extremes, and traders can toggle this feature on or off as needed.

Zero-Lag MA Trend Levels [ChartPrime] The Zero-Lag MA Trend Levels indicator combines a Zero-Lag Moving Average (ZLMA) with a standard Exponential Moving Average (EMA) to provide a dynamic view of the market trend. This indicator uses a color-changing cloud to represent shifts in trend momentum and plots key levels when trend reversals are detected. The addition of trend level boxes helps identify significant price zones where market shifts occur, with retest signals aiding in spotting potential continuation or reversal points.
⯁ KEY FEATURES & HOW TO USE
⯌ Zero-Lag Moving Average (ZLMA) with EMA Cloud :
The indicator employs a Zero-Lag Moving Average (ZLMA) alongside a standard EMA.
series float emaValue = ta.ema(close, length) // EMA of the closing price
series float correction = close + (close - emaValue) // Correction factor for zero-lag calculation
series float zlma = ta.ema(correction, length) // Zero-Lag Moving Average (ZLMA)
The cloud between these averages changes color depending on the trend direction. During a downtrend, if the ZLMA begins to increase, the cloud partially turns green, signaling potential strength. Conversely, during an uptrend, if the ZLMA decreases, the cloud partially turns to the downtrend color (blue by default), indicating potential weakness.
Use : Traders can monitor the cloud's color shifts for early signs of changing momentum. A fully colored cloud aligning with the current trend indicates a strong directional move, while mixed colors suggest a potential trend change.
⯌ Trend Shift and Level Boxes :
Each time a crossover between the EMA and the ZLMA occurs, indicating a trend shift, the indicator plots a box around the price level where the shift occurred. This box remains on the chart to mark the price zone of the trend change.
Use : The boxes provide clear visual markers of where market sentiment shifted. These levels can act as support and resistance zones. Traders can use these boxes to identify potential entry or exit points when the market retests these key levels.
⯌ Retest Detection with Labels :
If the price action crosses a previously plotted trend level box, the indicator marks this event with triangle labels. An upward triangle (▲) appears when the price retests the top of a box during a bullish crossover, and a downward triangle (▼) appears when the price retests the bottom of a box during a bearish crossunder.
Use : These labels help traders identify potential continuation or reversal points at critical price levels, offering additional confirmation for trading decisions.
⯌ Dynamic Color-Coding :
The color of the ZLMA and the EMA is adjusted according to their current trend direction, with the ZLMA adopting green for upward trends and blue for downward trends. This visual representation makes it easier to quickly gauge the market's momentum at a glance.
Use : Traders can use the color-coding to quickly assess the strength and direction of the current trend, allowing for more informed decision-making.
⯁ USER INPUTS
Length : Sets the period for both the ZLMA and EMA calculations.
Trend Levels : Toggle to display the trend level boxes on the chart.
Colors (+ / -) : Define the colors for bullish and bearish trends.
⯁ CONCLUSION
The Zero-Lag MA Trend Levels - ChartPrime indicator offers a nuanced approach to trend detection by combining the ZLMA with a traditional EMA. Its dynamic cloud color changes, trend level boxes, and retest labels make it a versatile tool for traders seeking to identify trend shifts and key price zones effectively. By incorporating elements of support and resistance along with trend momentum, this indicator provides a comprehensive view of market dynamics for both trend-following and counter-trend trading strategies.
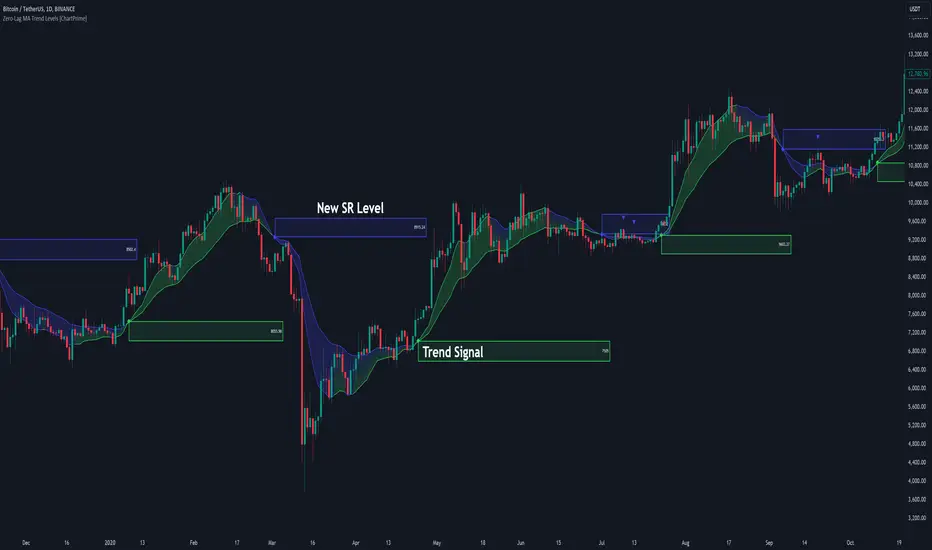
Volume Surge Momentum Detector [CHE]Volume Surge Momentum Detector – Discover explosive price movements fueled by sudden volume spikes.
Volume Surge Momentum Detector – Capture Key Inflection Points Using Volume Dynamics
Description:
This indicator helps traders identify highprobability entries by focusing on volume dynamics. Significant price movements often occur when interest in a stock rises, and this is reflected in volume spikes. The Volume Analysis Indicator is designed to detect key inflection points such as breakouts and capitulations by analyzing the relationship between volume and price. It enables traders to avoid false breakouts, identify trend exhaustion, and make informed trading decisions.
Key Features:
VolumeBased Inflection Points: The indicator tracks the volume levels to detect when there is significant interest in a stock. High volume signals increased market participation, often preceding large price moves.
Breakout Detection: It identifies breakouts by detecting price moves beyond a key level (the highest price over a certain period) along with a volume spike, indicating strong momentum.
Capitulation Detection: Capitulation is detected when a strong trend weakens and reverses with increased volume, signaling potential trend exhaustion.
Volume Thresholds: By using statistical measures, the indicator identifies unusually high or low volume based on the average volume and standard deviations, helping traders to spot major turning points in the market.
This tool simplifies volume bar analysis by automatically highlighting significant volume events, which often indicate large upcoming price movements.
Detailed Breakdown:
1. Volume as a Catalyst for Price Movements:
Volume is essential for price action. Without sufficient volume, price moves may not be sustained. This indicator highlights moments of increased market interest by tracking significant volume increases, helping traders stay ahead of major price movements.
2. Breakouts and Capitulation Detection:
Breakout: Detected when the volume exceeds an upper threshold (based on two standard deviations above the average volume) and the price breaks above the highest close of the previous period. These moments are marked with green labels on the chart.
Capitulation: Detected when volume increases significantly but the trend cannot sustain itself, and the price reverses below the lowest close of the previous period. These moments are marked with red labels on the chart, indicating potential trend exhaustion.
3. Sentiment and Market Dynamics:
Market sentiment can lead to price inflections when one side of the market becomes overbought or exhausted. Volume spikes in either direction provide clues as to whether a trend will continue or reverse. This indicator helps identify these critical points by monitoring volume patterns.
4. Visual Representation:
Green Bars: High volume indicating strong market interest or momentum.
Red Bars: Low volume, signaling potential lack of interest or exhaustion.
Gray Bars: Normal volume, helping to distinguish significant market events from regular activity.
Breakout and Capitulation Labels: Green labels for breakouts and red labels for capitulation points are shown directly on the chart for easy reference.
5. Alerts for Key Signals:
Breakout Alert: Notifies traders when a breakout occurs with strong volume, indicating a potential for significant price movement.
Capitulation Alert: Alerts traders when a capitulation occurs, suggesting a trend reversal.
High and Low Volume Alerts: Receive notifications when the volume exceeds the upper or lower thresholds, highlighting key moments of market interest or disinterest.
Why This Indicator Matters:
Traders often miss significant price moves or enter too late. This indicator helps traders by identifying highprobability entry points before the stock makes major moves. By focusing on volume spikes, the indicator provides insight into market sentiment and allows traders to act quickly.
How It Works:
1. Calculate Volume Significance: The indicator calculates the average volume over a userdefined period (`length`) and identifies significant deviations using standard deviations.
2. Mark Key Levels: Breakouts are detected when price moves above recent highs with significant volume, while capitulation is flagged when trends show exhaustion with a volume spike and price reversal.
3. Receive Alerts: Traders can set up alerts for key events like breakouts, capitulations, and significant volume changes to stay informed in realtime.
Perfect For:
Active traders looking to spot early market movements driven by volume changes.
Traders who want to avoid false breakouts by confirming price moves with volume spikes.
Swing traders identifying capitulation points to reduce exposure or enter positions on trend reversals.
How to Use:
Customize the "Average Period" to determine how many bars are used to calculate the average volume.
Adjust the "Multiplier for Standard Deviation" to finetune the sensitivity of high and low volume detection.
Enable alerts to receive realtime notifications for breakouts, capitulations, or volume spikes.
Conclusion:
Volume analysis is essential to understanding stock movements. This indicator simplifies the process of identifying breakouts and capitulation points by using volume dynamics. Whether you are a beginner looking for powerful tools or an experienced trader refining your strategy, this indicator offers valuable insights into market behavior driven by volume.
Additional Insights:
1. Statistical Significance: The use of standard deviations to identify high and low volume gives the indicator a statistical basis, helping to reduce noise and false signals.
2. Flexible Alerts: Traders can set up custom alerts based on their trading preferences, whether they focus on volume changes or price breakouts and reversals.
This detailed description now includes all the important aspects of the script without referencing any external sources, focusing solely on the functionality and trading strategy the script provides.
Best regards
Chervolino
